Grade distribution table
In order to fully understand the Grade Distribution Table at Fontys, the Grading system in the Netherlands is described below.
Grading system in the Netherlands
Dutch grades range from 1 (very poor) to 10 (outstanding); a 6 is a pass. It should be noted that 9s and 10s are rarely given. On final lists, grades are normally rounded off (above 0.5 is rounded up, and below 0.5 is rounded down; thus, a 5.5 equals a 6 equals a pass, whereas a 5.4 equals a fail (except for a few compensations). However, on exams and coursework, it is customary to get a grade that has not been rounded off. The Dutch grading system is listed in the table below.
| Grade | In words NL | Abbr. NL | Meaning EN | Abbr. EN |
| 10 | Uitmuntend | U | Outstanding | O |
| 9 | Zeer Goed | ZG | Very Good | VG |
| 8 | Goed | G | Good | G |
| 7 | Ruim Voldoende | RV | More than Satisfactory | MS |
| 6 | Voldoende | V | Satisfactory | S |
| 5 | Twijfelachtig | T | Almost Satisfactory | AS |
| 4 | Onvoldoende | O | Unsatisfactory | U |
| 3 | Ruim Onvoldoende | RV | Very Unsatisfactory | VU |
| 2 | Slecht | S | Poor | P |
| 1 | Zeer Slecht | ZS | Very Poor | VP |
| Expression NL | Abbr. NL | Meaning EN | Abbr. EN | ||
| Behaald | BEH | Pass | Pa | ||
| Niet Behaald | NB | Fail | F | ||
| Vrijstelling | VR | Exemption | Ex |
Grade Distribution Table
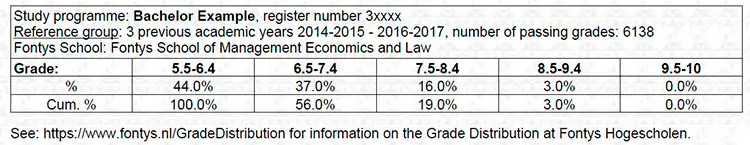
To help other universities and potential employers interpret your grades' value, Fontys publishes Grade Distribution Tables for Bachelor’s and Master’s graduates.
The Grade distribution tables provide statistical distributions of grades awarded at Fontys University of Applied Sciences. They show which percentage of all passing grades that were awarded in the three most recent academic years were (rounded off) a 6, a 7, an 8, a 9 and a 10.
The tables are published on the Diploma Supplement of all graduated students as of October 2018.
The Grade Distribution shows the culture of the grades awarded so that they can be compared to the grade awarding culture of other universities and institutions of Higher Education. The table does not show whether you belong to the best of your year. Neither does it give information about the average grades.
The grade distribution table (GDT) allows for comparison with the statistical distribution of grades in a parallel reference group of another university/institution. The GDT represents the statistical distribution of positive grades (pass and above) awarded in each field of study or subject within the study programme described in the Diploma Supplement.
This GDT can be used for grade conversion as follows:
- Compare the grade distribution presented with the one developed by the other institution for the parallel reference group.
- The position of each grade within the two tables can be compared and
- On the basis of this comparison, individual grades can be converted.
For instance, you achieved a 7,5 for a certain subject. According to the table, that grade falls in the range of 7,5 to 8,5. 16% of the reference group also received that grade in that range. Of all the results within your study programme, 19% was ultimately a 7,5 or higher.